


OOPS'17: Crossing Abstraction Barriers When Debugging in Dynamic Languages
I’ll be on OOPS'17 in Marrakech (part of SAC'17, on Thursday April 6, between 9:15 and 10:40) and speak about my work on crossing abstraction barriers. When we debug an issue, we continuously bisect the range of where the mistake may be. Sometimes we want to zoom into implementation details of third-party software to understand what it is supposed to do and how. Maybe there is a misunderstanding or a bug?
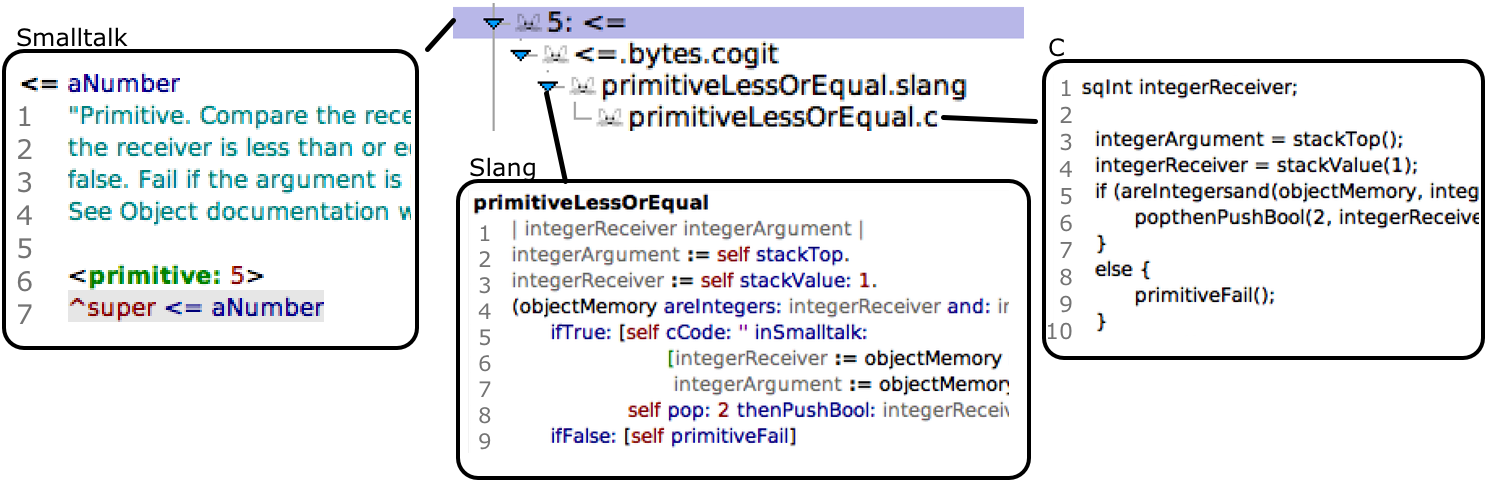
In our debugger, stack frames of multiple language levels are explorable from a
single user interface. For the <= primitive, we not only see the Smalltalk fallback, the Slang implementation
of it, and the C code that gets generated from it.
Abstract
Programmers use abstractions to reduce implementation effort and focus on domain-specifics. The resulting application often runs in a convenient guest runtime that is provided by an increasingly complex ecosystem of libraries, VMs, JIT-compilers, operating systems, and native machine architectures.
While abstractions are designed to hide complexity, experience tells us that “All non-trivial abstractions, to some degree, are leaky.”1. Leaky abstractions are problematic, for example, when the use of under-documented or unspecified behavior of a library or virtual machine causes a failure in domain-specific code. Users may need to understand whether the virtual machine is just under-documented but working as intended or faulty. At that point, the artificially created barrier that protects language users from domain-independent complexity becomes an obstacle. We call this crossing the abstraction barrier.
Prior research has investigated how symbolic debuggers can work across language barriers. However, this resulted in dedicated workflows and UIs that differ substantially from traditional symbolic debugging. Users need to remember these rather elaborate workflows, and the learning effort is often larger than the perceived benefit of answering the given debugging questions. As a result, the value of these tools may not be immediately recognized and developers will only consider learning them after having spent much time with conventional debugging methods.
We propose an interaction model that generalizes the conventional symbolic debugger so that the known workflow can be kept and users can opt-in to cross-abstraction debugging when necessary. By replacing the traditional list view on the active call chain with a tree model and adding perspective selection, we obtain an unobtrusive, minimal user interface that still offers powerful cross-language debugging features.
Paper
You can read the Paper Preview here.
Advanced Walkthrough
We are in an application and debugging the issue that minSmallInt // -1 is returning
minSmallInt instead of -minSmallInt (the bug really occured in CogVM). We step through the application, AST, and Smalltalk Bytecode. On the lower levels, we have a feature to debug the translators and finally fix the bug of the JIT-Compiler right in the debugger.
Slides
I spoke about it on Thursday April 6 2017 at 9:15 - 10:40 in Room: Coriandre I &II at the OOPS track. Here are the slides:
Copyright
DOI: http://dx.doi.org/10.1145/2892664.2
© ACM, 2015. This is the authors' version of the work. It is posted here by permission of ACM for your personal use. Not for redistribution. The definitive version will be published in proceedings of the ACM Conference on Object-oriented Programming, Systems, Languages, and Applications.
Discussion, links, and tweets

I care about lots other interesting things as well. Follow me on Twitter to get an impression of that. Or contact me directly on another channel or come along to visit me.
Tweet Follow @abstractourism